
ABOUT
Species list
The taxonomic level used in this project is the species. EBCC adopted the HBW-BirdLife species checklist for all its projects in 2017, including EBBA2, as it was the most widely used in an international context in Europe.


Study area
The EBBA2 study area covered all of Europe, including the European parts of Russia and Kazakhstan, Transcaucasia, the whole of Turkey and Cyprus, as well as the nearby archipelagos in the Atlantic and Arctic oceans and in the Mediterranean Sea.
Study period
The main time frame for EBBA2 fieldwork was the period 2013 to 2017. Some exceptions were granted in order to substantially increase the amount of data in areas where fieldwork could not be fully carried out during this period, e.g. due to an insufficient number of observers, financial constraints, remoteness of study areas, political conflicts hampering fieldwork, or available data from national atlas work carried out in the years preceding EBBA2. In these cases older data were partially used or the fieldwork period was extended into 2018.
Data sources
Fieldwork for EBBA2 did not follow a common procedure in each country and the data sources varied among countries. Four main types of sources were identified: atlas data (At), monitoring data (Mon), casual observations (Cas) and targeted EBBA2 surveys (Tar). Each country developed its own strategy to provide the data for EBBA2. This was seen as an advantage rather than a limitation because the different situations in each country could be taken into account. Nevertheless, this variety of data sources required common standards at the European level for a proper integration of the data.

Grids
Bird atlases usually show species distribution on a regular subdivision of the territory by means of a grid. Two grid systems were used in EBBA2, depending on the type and purpose of each map. For breeding evidence, abundance and change maps, the 50-km Universal Transversal Mercator (UTM) grid that was used in EBBA1 was also selected for EBBA2. However, for the EBBA2 modelled maps (a novelty of the second atlas) the current European standard Grid ETRS89-LAEA 10-km grid was employed.

BREEDING EVIDENCE
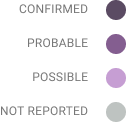
Birds are mobile species and can be observed far from the areas where they reproduce, e.g. as visitors during migration or post-breeding dispersal. Standardised categories to determine whether a species is a possible (A), probable (B) or confirmed (C) breeder in the surveyed area were used for EBBA2. Depending on the characteristics of the observation in the field, it was assigned to a given atlas code, and the maximum atlas code recorded per 50-km square was used in EBBA2 to document the breeding evidence for that species in that square.

Abundance
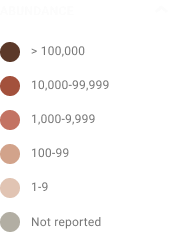
Order-of-magnitude estimates of number of breeding pairs per 50-km square were used in EBBA2, categorised on a logarithmic scale in six classes (1–9, 10–99, 100–999, 1,000–9,999, 10,000–99,999 and 100,000–999,999 pairs). A set of guidelines was provided to national coordinators to help them assess bird abundance per square and report the protocol used to EBBA2. Depending on the characteristics of the species and the data available, three main protocols were used: direct count, statistical inference or expert assessment.
Timed surveys
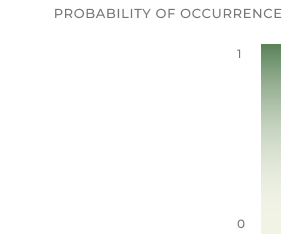
Data from timed surveys were used to model the relative probability of occurrence of breeding birds in 10-km squares. Standardised data originated from any source that specified the time used to compile a complete list of observed breeding bird species. These data came from line transects or from combining a number of point counts. Based on a sample of timed surveys, probability of occurrence was modelled using eight different Species Distribution Modelling (SDM) techniques which included information on observed presence/absence of birds, environmental predictors, detection probability and spatial autocorrelation. In a final step the modelled distribution was cropped to the broad patterns of a species’ range.
Data validation
Validation of the quality of the data was extremely important in EBBA2. Several online tools and protocols assisted national and European coordinators to check whether data (shown in preliminary maps and graphs) was consistent with previous knowledge on distribution and phenology or should be carefully revised.
Single species maps
50-km breeding evidence map
The EBBA2 project collected information on the occurrence of breeding species, which was aggregated at the level of 50-km squares. Birds are mobile species and can be observed far from the areas where they reproduce, e.g. as visitors during migration or post-breeding dispersal. Standardised categories to determine whether a species is a possible, probable or confirmed breeder in the survey area were used for EBBA2.
50-km abundance map
Order-of-magnitude estimates per 50-km square were used in EBBA2, categorised on a logarithmic scale in six classes (1–9, 10–99, 100–999, 1,000–9,999, 10,000–99,999 and 100,000–999,999). These minimum and maximum numbers could refer either to the uncertainty of the estimation procedure, or to the observed between-year variation of population size in the EBBA2 period (2013–17).
10-km modelled map
10-km modelled maps complement 50-km maps showing occurrence at a finer scale. We produced modelled maps at 10-km resolution for as many species as possible based on a massive standardised collection of data from across Europe. EBBA2 standardised “timed surveys” were defined as daylight bird surveys of 30–180 minutes conducted on a single day within the breeding period in any of the fieldwork years (2013–17). Data were collected for a total of 23,303 different 10-km squares located across the whole of Europe. Probability of occurrence was modelled using eight different Species Distribution Modelling (SDM) techniques which included information on observed presence/absence of birds on the standard timed surveys, environmental predictors, detection probability of bird species as well as spatial autocorrelation. In a final step the modelled distribution was cropped to the broad patterns of a species’ range.
Change between EBBA1 and EBBA2
We decided to restrict the change map to a well-defined, continuous geographical area based on coverage in EBBA1. Consequently, a vast area in eastern Europe was excluded from the geographical area used in the change maps. In addition, we developed specific criteria based on the reported information on survey completeness and observed species richness to determine the set of 50-km squares that allowed a robust comparison of information on bird occurrence between the two atlases. We quantified the change in distribution by calculating a Change index = 100*(N2–N1)/(N2+N1), where N1 and N2 are the number of occupied squares for a given species in the EBBA1 and EBBA2 periods, respectively. Positive and negative values of the change index indicate the extent to which distribution increased or decreased: 0 indicates no change, –100 extinction and +100 colonisation.
Multispecies maps
EBBA 2 – Richness
EBBA 2 – Richness maps show the total number of bird species observed within each 50-km square in EBBA2 from a particular selection of species: i) all species, ii) native species, iii) non-native species and iv) habitat-related species. The latter category is composed of birds associated with seven main habitat types: Agricultural & grassland, Montane grassland, Mediterranean habitats, Boreal & temperate forest, Tundra, mire & moorland, Inland wetlands, Marine & coastal. The particular species list is shown in the Map viewer below the legend. See the EBBA2 book for details on the assignment of species to habitats.
CHANGE (EBBA2 vs EBBA1)
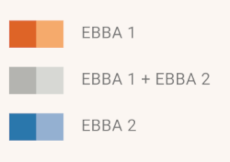
CHANGE (EBBA2 vs EBBA1) maps show the difference between the number of species observed in EBBA2 and EBBA1, with blue colours indicating gains and orange colours indicating losses. Grey colours show squares in which this difference was not calculated because these square was not sufficiently covered either in EBBA1, EBBA2 or both. The particular species list is shown in the Map viewer below the legend. See the EBBA2 book for details on the procedure used to determine the set of squares insufficiently covered.
